Any operator providing video services is faced with a fundamental operational challenge –with tens of thousands or millions of subscribers using their services every day with different apps, devices, across networks and regions – how can I make sense of potential terabytes of performance data and act on this in a timely manner?
At Agama we describe what we do as Video Observability – understanding the behavior and performance of video creation, delivery and consumption based on end-to-end monitoring and analytics allowing operators to be data-driven and collaborative.
This article will focus on one important aspect of our solution – how the massive dynamic grouping capability creates insights and drives value at our users.
How to deal with increased complexity
We live in a dynamic world where all the components of the service delivery and creation are in a state of change and enhancement, with configuration changes, feature additions and bug corrections. Updating the player app for instance is something that can happen on a weekly basis. Directly understanding if any such change is impacting the video experience is extremely valuable in an operational and product context.
Working with metadata as a basis for aggregation and analytics is a powerful method to manage this complexity and cornerstone in our solution for video observability.
Metadata – what is it and where does it come from ?
We refer here to metadata as specific data that can be used to describe a device or service. It can be for example a version of an app, what CDN service is being consumed from, or network topology information. Metadata is not static but evolves over time and it can come from multiple sources. The device itself can of course provide information such as device type, OS version, app name, type of network connection etc.
Being able to use metadata provided from backend sources is also very powerful. For example, setting different service levels for subscribers allows SLOs (Service Level Objectives) to be tracked across the different customer tiers to help guide operational prioritization. Both types of metadata – from clients and from backends – can be used at the same time in the Agama system.
Another example is connecting a specific customer device to the place it is located. Here at Agama, we refer to that metadata as Logical Path Identifier (LPI). By extracting that from the network inventory and ingesting it into Agama, it’s possible to create network performance maps of the complete access network topology with tens of thousands of groups. With the rich metric set in the solution, this means tracking tens of millions of real-time aggregates.
Metadata as a driver for analytics
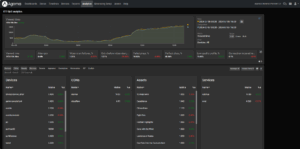
The metadata both pushed in real-time from subscriber devices and from backend API sources, can be used for extracting insights. An example is the OTT QoS Analytics app which can be used both for creating a high-level view of all relevant dimensions in the system and as a tool to drill down and identify areas with specific problems.

The app allows Ops teams to directly correlate and compare the most important KPIs for many different types of groups – type of devices, CDN, edge caches, type of service, region. All of this is generated in real-time using the metadata tagged for devices and services.
Going back to the network topology example, this provides more accurate and timely insights compared to traditional network analytics, including being used for closed-loop network automation. Our scalability, where massive real-time grouping can be made based on hundreds of thousands or millions of customer devices, is the foundation for creating these insights.
Wrapping up
There is no doubt that the creation of many thousands of relevant groups and aggregates is a core capability in Agama and something that differentiates us from other solutions on the market. The resulting insights and data are made available across our different applications – both as current status in the dashboard, in alerts, as well as overtime for correlation and comparison. Time and again we see how this generates large values both in terms of cost savings, deployment agility, and improved customer experience across technologies and types of operators, improving observability and reducing reaction times.
With a variaty of apps that visualize and highlight the KPIs for different types of workflows the solution puts this power into the hands of the relevant Ops and product teams. This makes a real difference when it comes to delivered video service performance and reliability, and ultimately, customer experience.
About Johan Görsjö
Johan leads the Product and Development, responsible for revolutionizing Agama’s products and solutions. He works with Product Strategy and closely with Sales and Marketing.
Johan has over 20 years of experience in the Telecom and Video industry.

